Preparing Date Report
The Prepare Date Report button provides a method for showing individual golfer or team scoring and match information by date over a selected period of time. This is especially useful for creating reports for golf leagues, weekly club events and even golf vacations. The Date Report is displayed in the Date Report sheet.
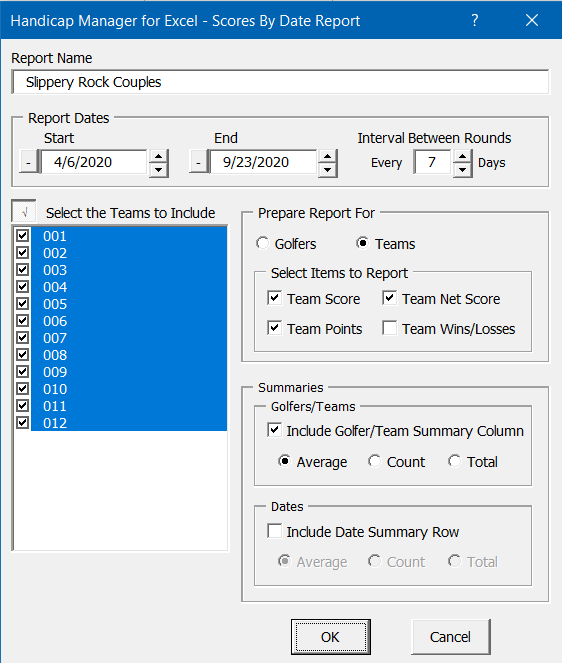
Click the Prepare Date Report button on the Main Menu sheet or the New Report button on the Date Report sheet to display the Date Report form. You can change the name of the report by entering a new name in the "Report Name" field. Enter the Start Date, End Date and the interval between rounds in days in the "Report Dates" section. For example, if your golf league plays once a week on Wednesdays starting with the first week in May and Ending with the last week in October, enter the first Wednesday in May for the Start Date, the last Wednesday in October for the End Date and 7 for the "Interval Between Rounds." Don't worry if you occasionally skip a week or play on a different day. These dates can be adjusted later.

Next, select whether you wish to prepare the report for individual golfers or teams by selecting the appropriate option button. You can also select which items you want to include in the report. If you are creating the report for individual golfers, you can report on gross score, net score or both. If you are creating the report for teams, you can report on team gross score, team net score, team points or team wins and losses. You can select which golfers or teams are included in the report. If you are creating a report for individual golfers, you can also select how you want the report sorted. You can sort by Golfer ID, Name, Team ID or Handicap Index. Date Reports created for teams are always sorted by Team ID.

You can also choose to summarize the data by including a summary column to the right to summarize the data for each golfer or team and/or including a summary row at the bottom to summarize the data for each date. Just select the item(s) you wish to summarize in the "Summaries" section. In addition, you can select how you wish to summarize the data. You can elect to average all the entries, count the number of entries, or total all the entries. Just select the option you prefer.
Once you've gone through and selected all the data and options for the report, click OK and the worksheet will be formatted to display the information that you selected. You can print the worksheet using Excel's print function, export the worksheet to a new workbook file using the Export button or save the report as an HTML file using the Create Web HTML Reports button on the Main Menu sheet. Use the Page Layout tools on Excel's ribbon to define how you want the page printed. Column headings are printed at the top of each page by default. You can also save the report as a PDF file using Excel's Save As command to save it in that format.
If you need to modify some of the report dates along the top of the columns, you can simply go to the cell with the date you to change and type in the new date. Then click the Refresh Report button to populate the new date. If you need to remove or skip any dates, just select the date you want to remove and click the Delete Date button.
Visit Checkbook on Facebook
Visit Handicap Manager on Facebook