DJI Computer Solutions
Software Applications for Microsoft Excel
The most unique, full featured spreadsheet applications on the web. These are not your father's spreadsheets!
The most unique, full featured spreadsheet applications on the web. These are not your father's spreadsheets!
The real power of Golf Tracker for Excel becomes apparent by creating reports to display and analyze your data. All of the report and analysis features of the program use the report data. To create a new report, click the Prepare Report button on the Main Menu sheet or the New Report button on the various report sheets. This will display the form shown below, which you can use to limit the data in your report in a host of different ways.
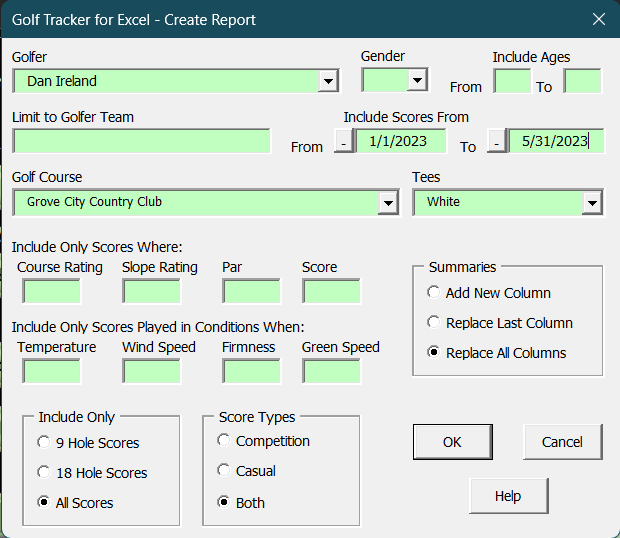
Select a golfer from the golfer drop down list to limit your report to one golfer or leave it blank to include all golfers. You can limit the report to golfers on a specific team by entering the team name (or leave it blank to include all teams). To create reports for golfers in a certain age group, enter ages in the two edit boxes Include Ages ______ to ______. If you want only golfers greater than or equal to age 15, enter 15 in the first field and leave the second field blank. Conversely, if you just want golfers less than or equal to age 49, leave the first field blank and enter 49 in the second field. Leaving both fields blank will include golfers of all ages. You can also opt to report only male or female golfers by selecting the appropriate gender option. Once again, leave the field blank to report on both male and female golfers.
You can limit the report to include only rounds played between certain dates by entering dates in the two edit boxes Include Scores From _______ to _______. To include only statistics from a particular golf course in your report, enter the name of the course in the Golf Course field or select it from the drop-down list. You can also limit the report to a specific set of tees by entering or selecting the tees in the Tees field. You can use wildcards in the Golfer, Golf Course and Tees fields. For example, entering Augusta* in the Golf Course field will create a report that includes all rounds played at any course starting with Augusta, i.e., Augusta National and Augusta Country Club. (For more information on the use of wildcards, go to Excel help and search on wildcards.) Leave the fields blank to include all dates or golf courses.
You can limit the report to rounds with certain course ratings, slope ratings, course pars and scores by entering numbers into the respective edit boxes. You can prefix the numbers with less than (<), greater than (>), and equal to (=) signs. For example, entering >=72 in the Course Rating field will limit your report to rounds where the course rating was greater than or equal to 72. Entering <80 in the Score field will limit your report to rounds where your score was less than 80. If you do not want to limit your report based on course rating, slope rating or score, leave the fields blank.
You can limit the report to rounds played under specific weather and/or course conditions by entering numbers in the appropriate fields. You can prefix the numbers with less than (<), greater than (>), and equal to (=) signs. For example, entering >=10 in the Green Speed field will limit your report to rounds played where the green speed was 10 or greater on the stimpmeter. Entering >10 in the Wind Speed field will limit your report to rounds played when the wind speed was greater than 10.
You can include only 9 hole, 18 hole rounds or both by selecting the appropriate option button. You can also limit your report to competition scores, casual scores or both using the options in the Score Types group. You must also select where to place the summary data on the Report Summaries sheet. Select the Add New Column option button to append the summary data in a new column to the right of the existing data. Select the Replace Last Column option to replace the right most column with the new summary data. Select the Replace All Columns option button to replace all the existing data on the Report Summaries with the new summary data.
When you click the OK button, a new report will be created on the Report sheet and added to the Report Summary sheet. In addition, each round included in the report will be summarized on the Report Data sheet. Depending on the amount of data in your report, this process could 20 or 30 seconds. To view the Report Summaries sheet, click the Summaries button on the Report sheet. To view the Report Data sheet, click the Report Data button on the Report sheet. You can also switch to these sheets using the sheet tabs at the bottom of the Excel window.
You can also export the Report sheet as a separate Excel file by clicking the Export Sheet button on the Report sheet. This will create a separate copy of the report so you can save it as a separate file as a permanent record of the report. This allows you to maintain multiple reports for later comparison and review.
The Report Summaries and Saved Summaries sheets allows you to compare several reports side-by-side when you create reports using the Add New Column option button. For example, you may want to compare your performance on two different courses or you may want to compare your statistics for last year vs. this year. You can also compare statistics for different golfers, different teams, different course ratings, slope ratings, etc. The possibilities are almost endless. See the Report Summaries topic for more details on how to utillize this feature.
Visit Checkbook on Facebook
Visit Handicap Manager on Facebook